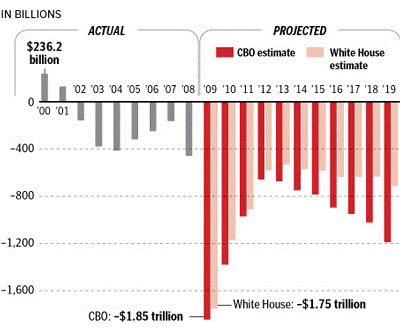
This graph shows Obama administration estimates of federal budget deficits over the next ten years. Notice that in every year the White House lowballs their numbers in relation to the Congressional Budget Office estimates for the same years.
Economist Mark Skousen refers to this as "the scariest chart I've ever seen", and I'm inclined to agree.

No comments:
Post a Comment